Macro Aspect
As of 2nd quarter 2025
This stop is to look at current market sentiment and direction. Right now the market look bullish and below are the reasons.
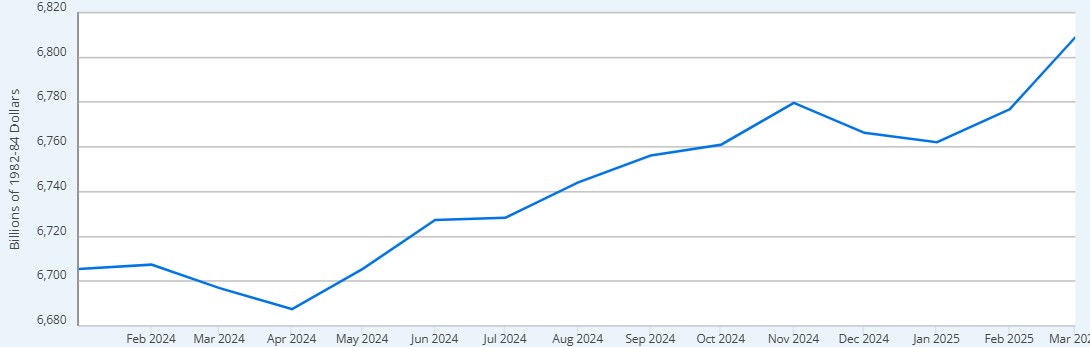
Looking at the m2 money supply the speed at which it is increasing is steady indicating no reversal or any disruptions.
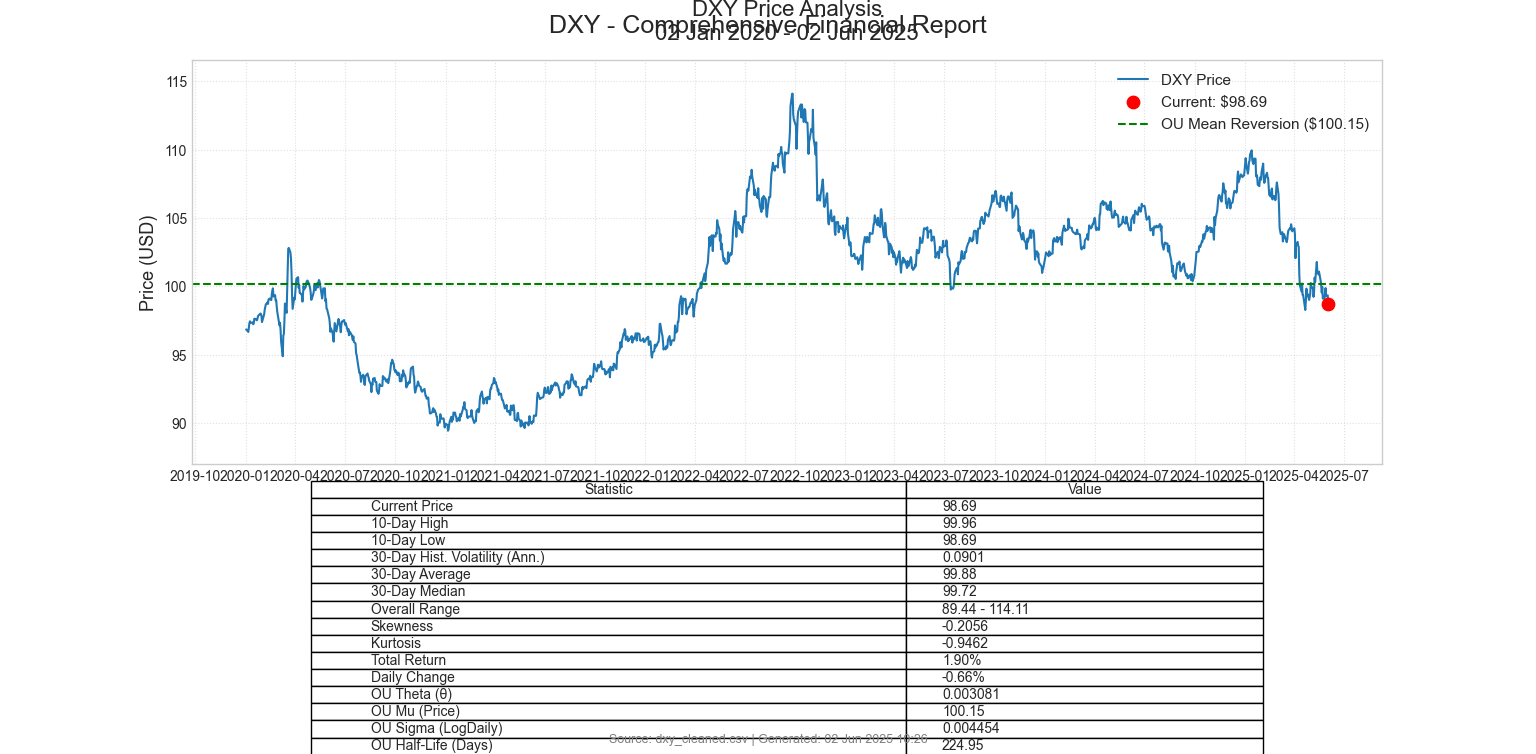
Also looking at the DXY (dollar index) we can see that it is in bearish momentum currently.
Running my python script we are able to see the folllowing data and charts. It is below its 30 day average and looking towards the ornstein-uhlenbeck process we can see a μ of 100.15 with a half life of 224.95 days. This can be due to the low θ figure which indicates the rate of reverting back to the mean. The data collected is the last 5 years.
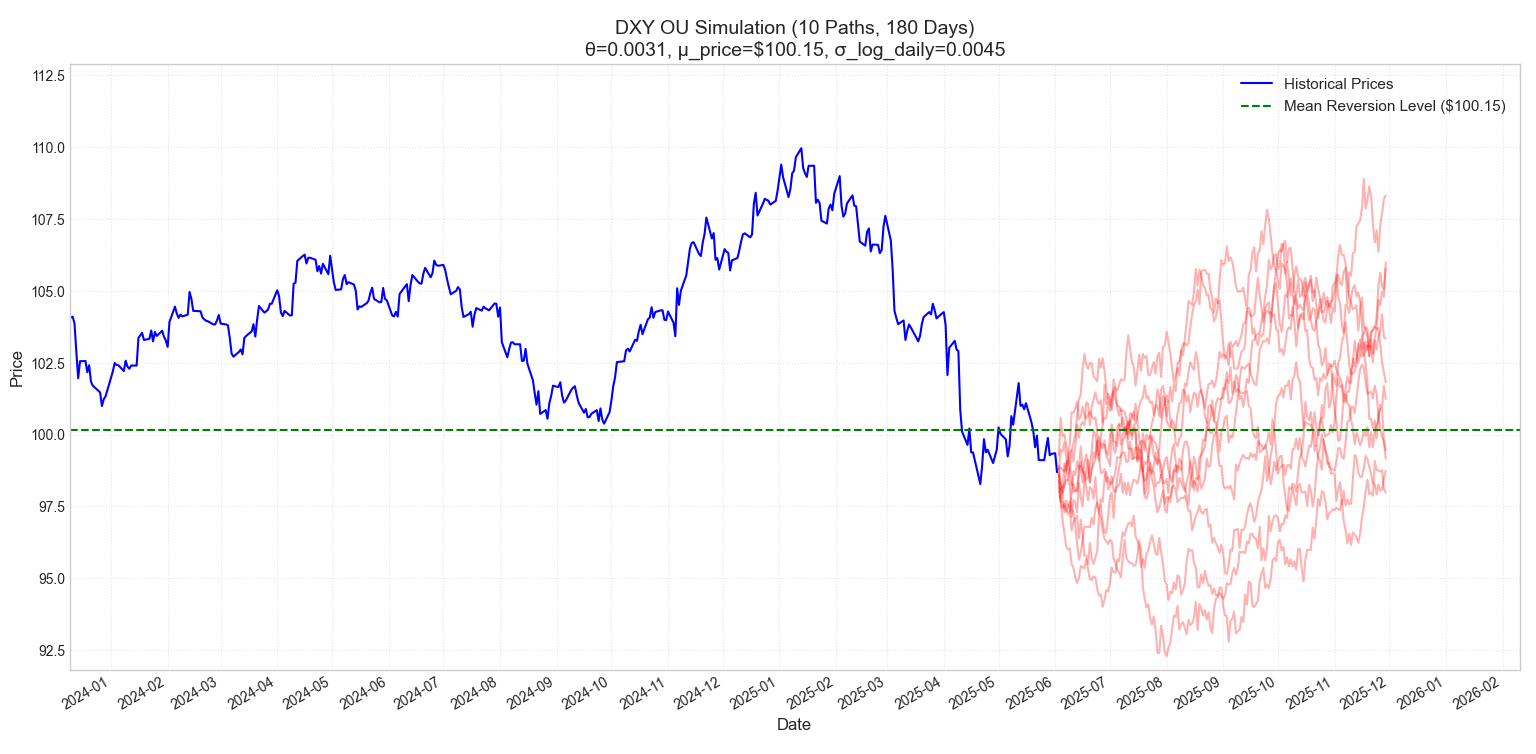
When looking towards the OU forecast we can see high volatility but towards the fourth quarter we can see all projections becoming bullish.
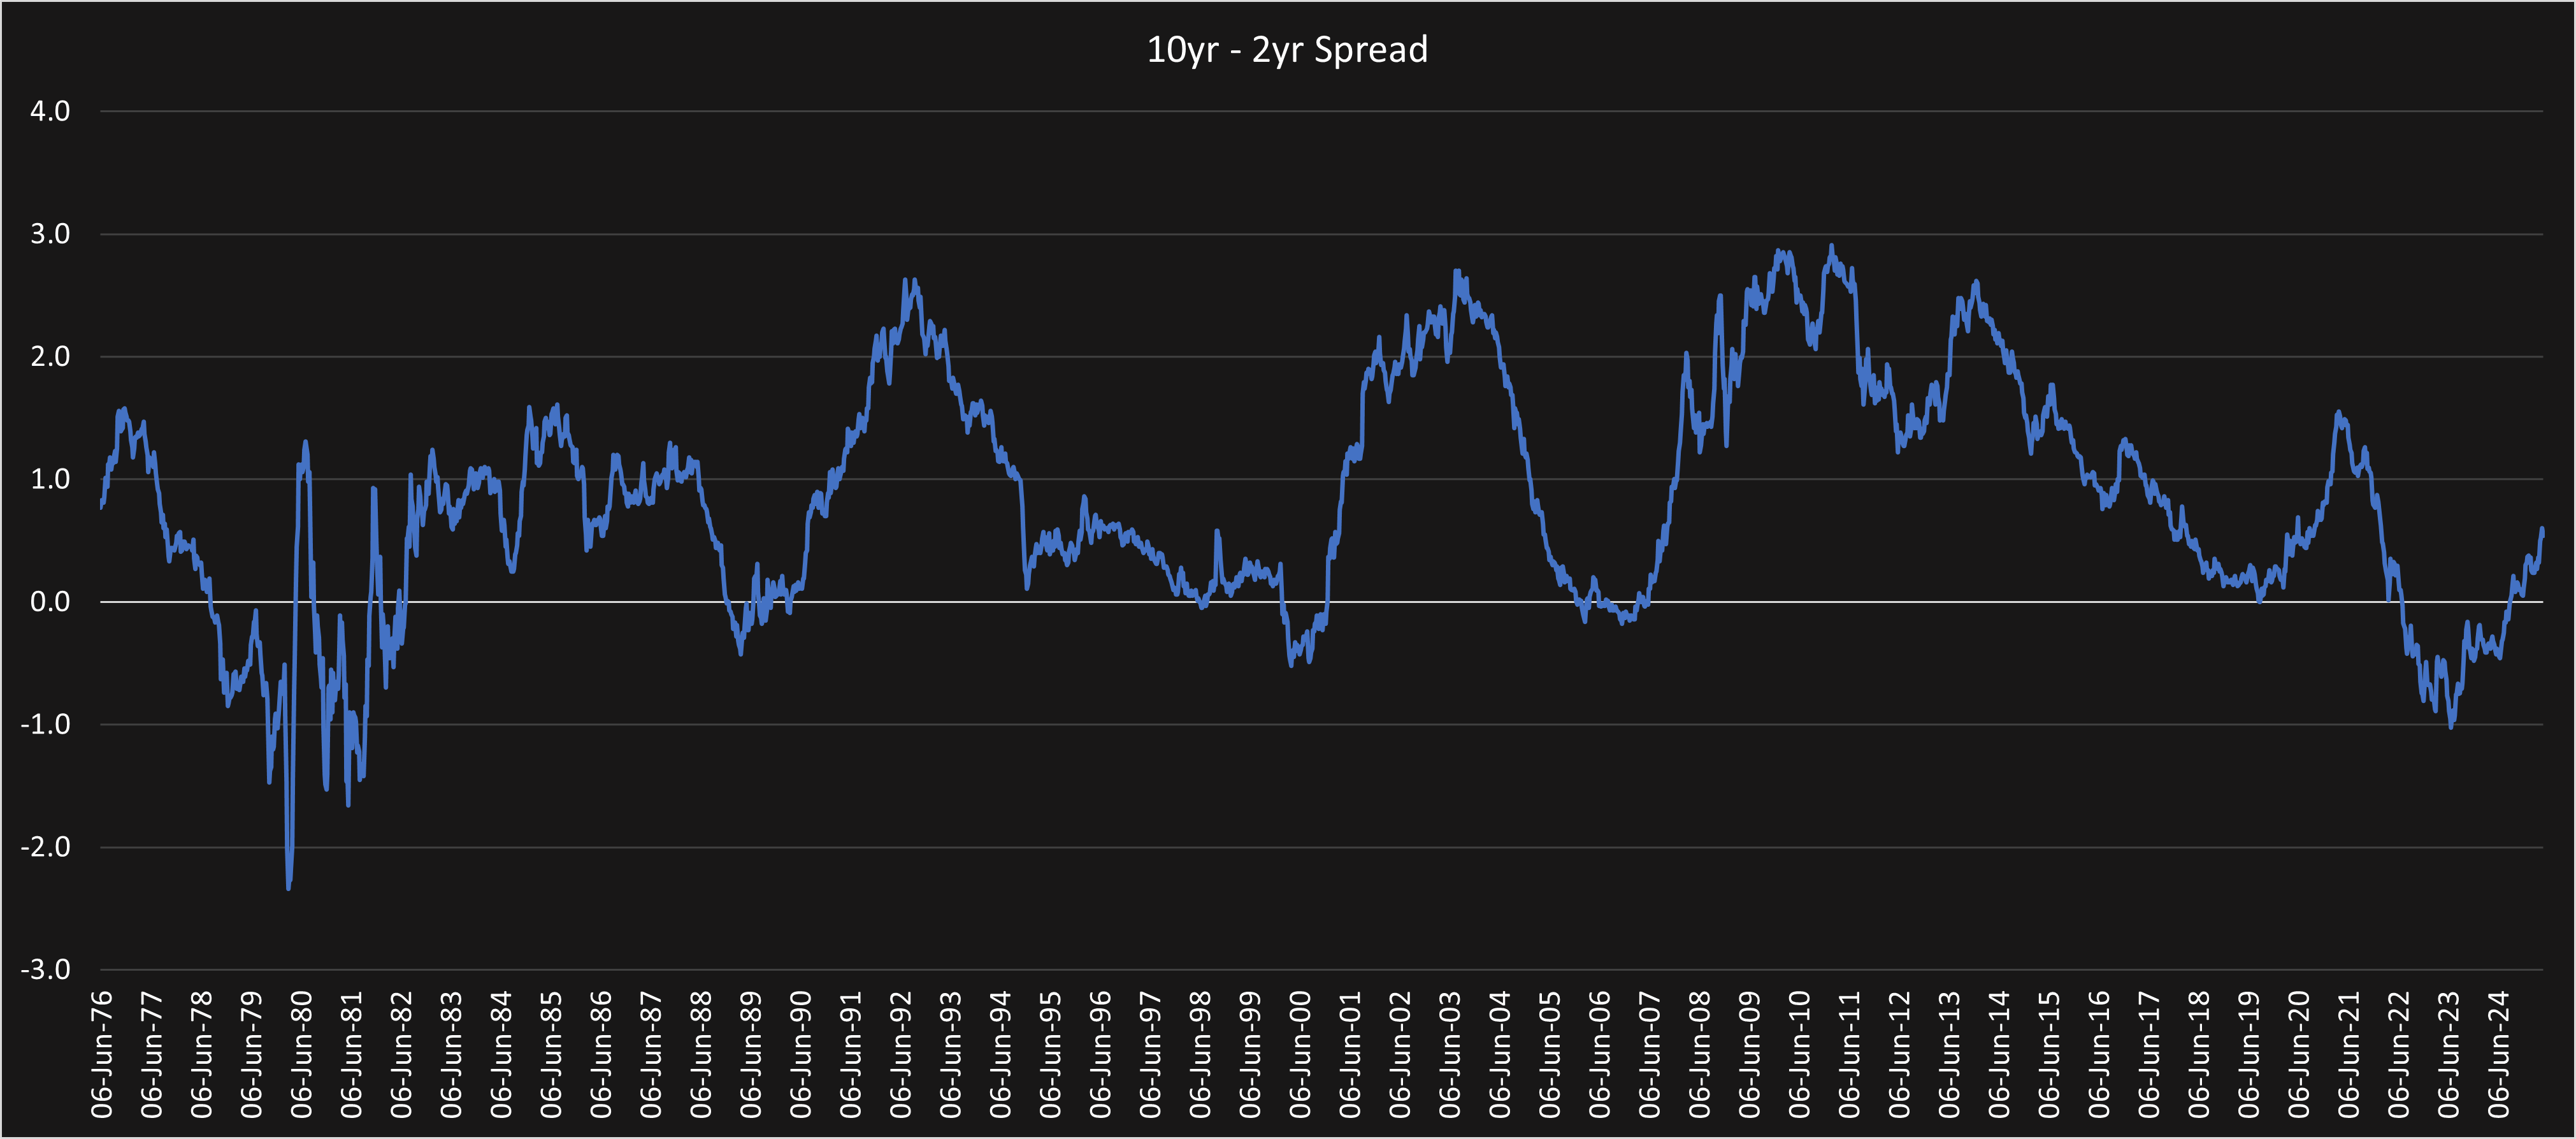
Furthermore looking at treasury spreads, especially the 10s-2s, we are able to see an economic expansion rather than a contraction.
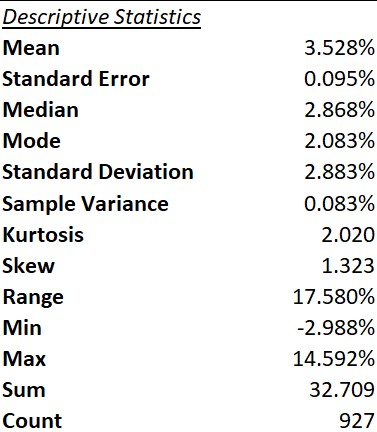
Also looking at CPI and PPI data we are able to see the rate of change slow down it may be indicating disinflation with possible monetary policy taking place.
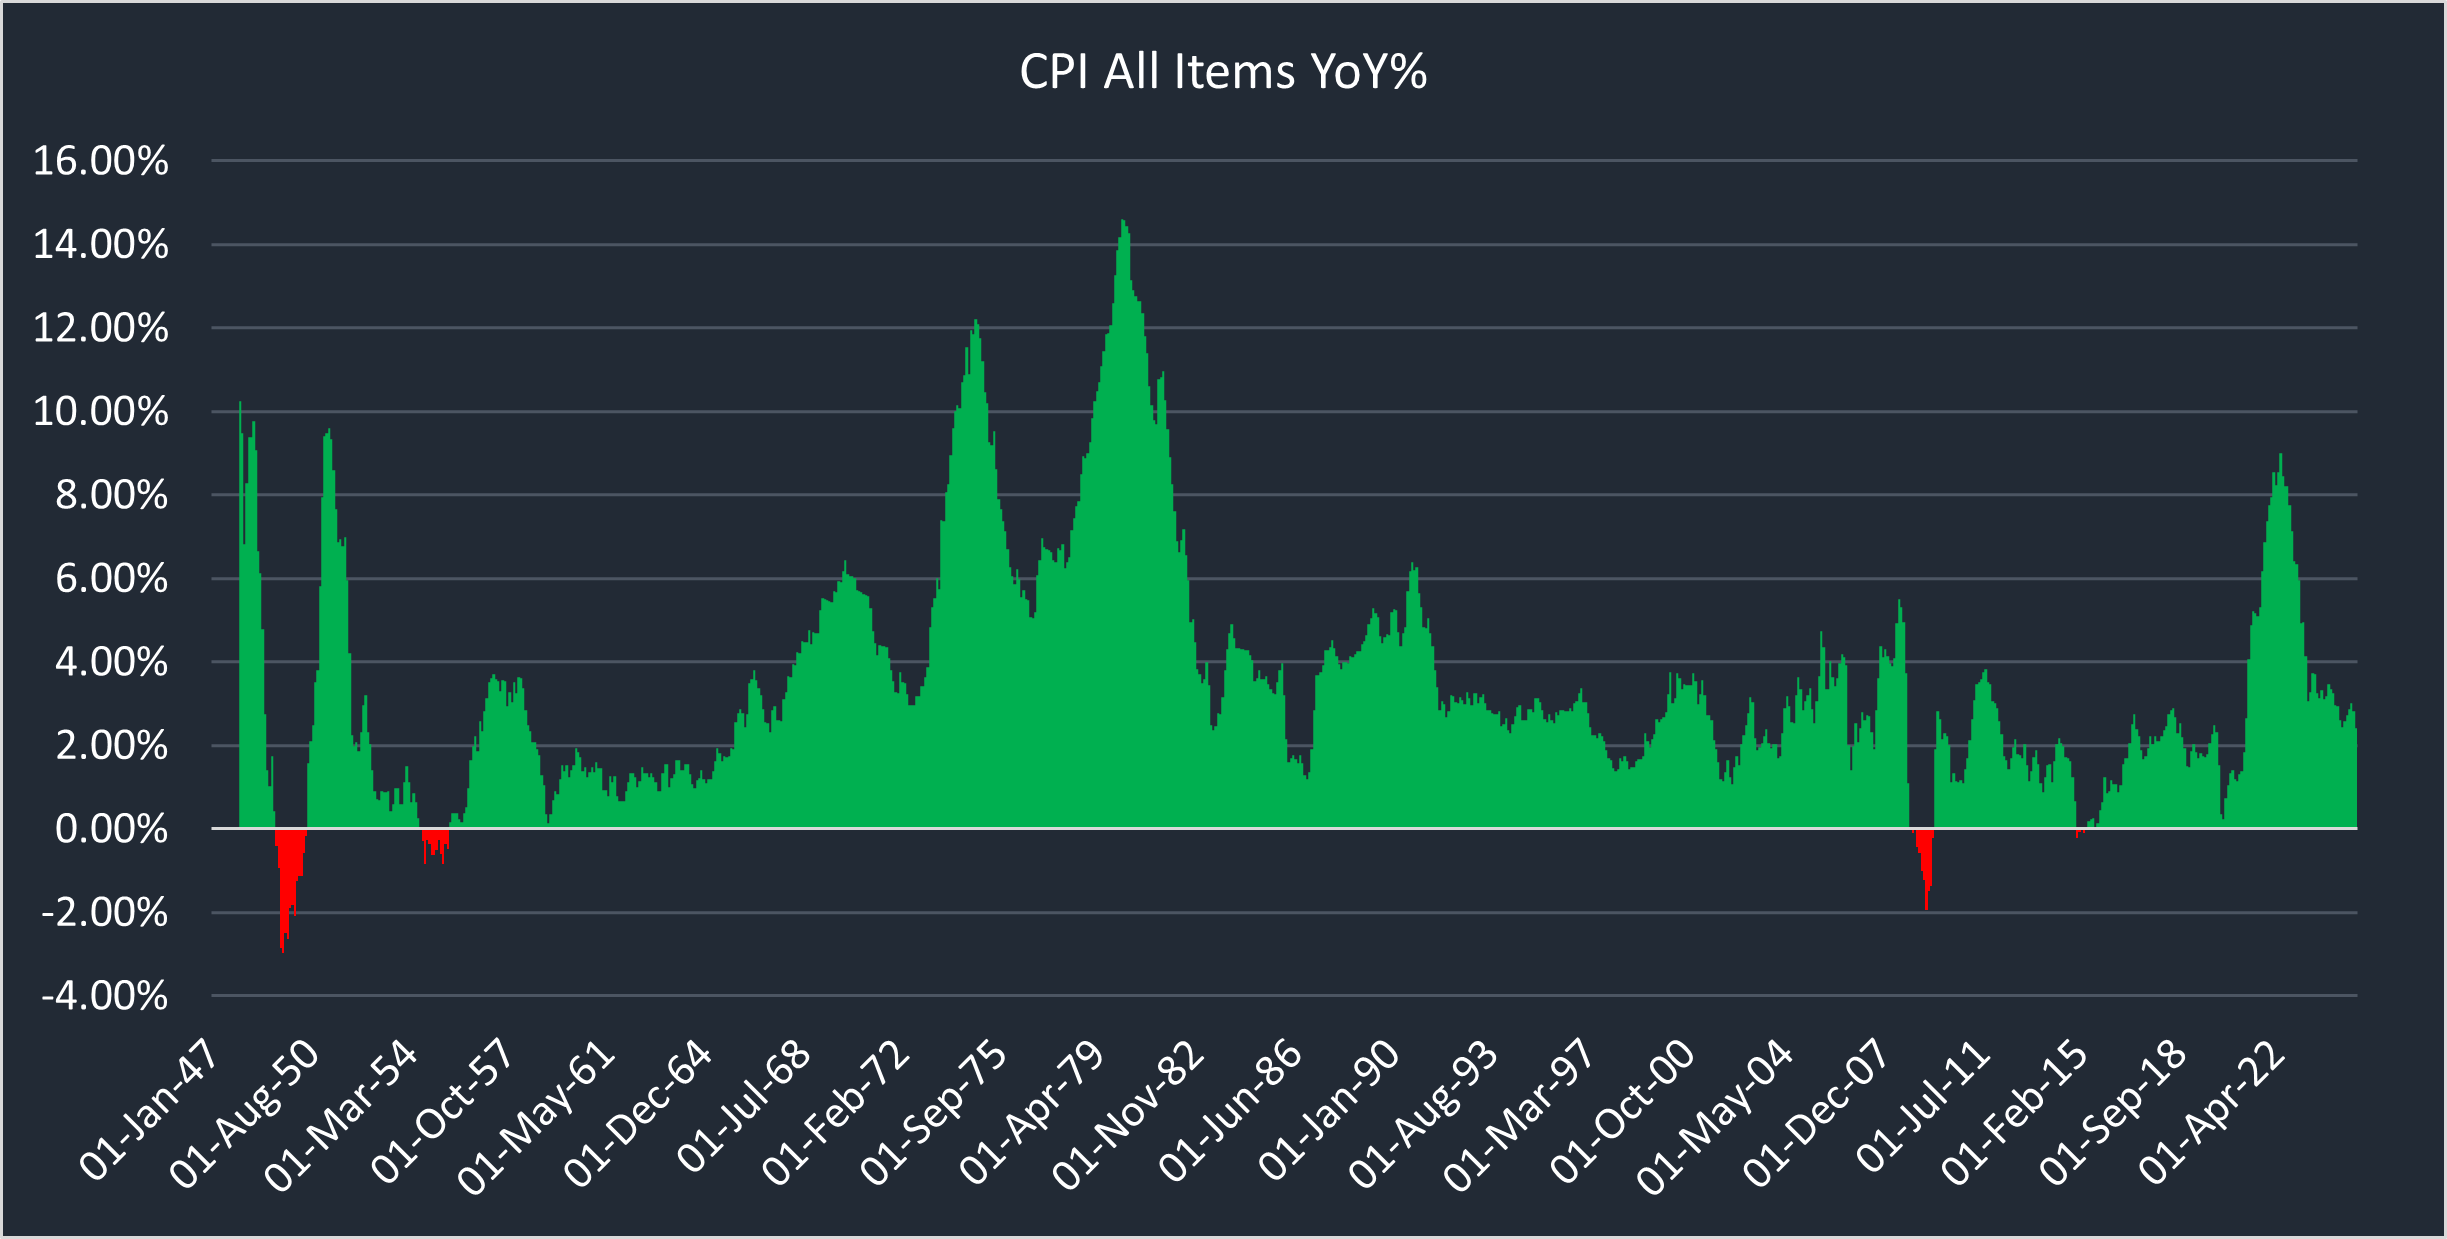
Looking at the descriptive statistics we can see the standard deviation being 2.883% which is higher then the current 2.41% standard deviation level of CPI showing reduced volatility
Looking at the 6 month lagged S&P500 price with the GDP data we can see that the S&P500 increases whilst the current GDP has dropped in 2025 in the first quarter. But this can be played off as fundamental reasoning with Trump first quarter in office. We should see a rebound up which is currently occuring.
Current outlooks
This stop is my current outlooks which I am projecting will occur with specific assets.
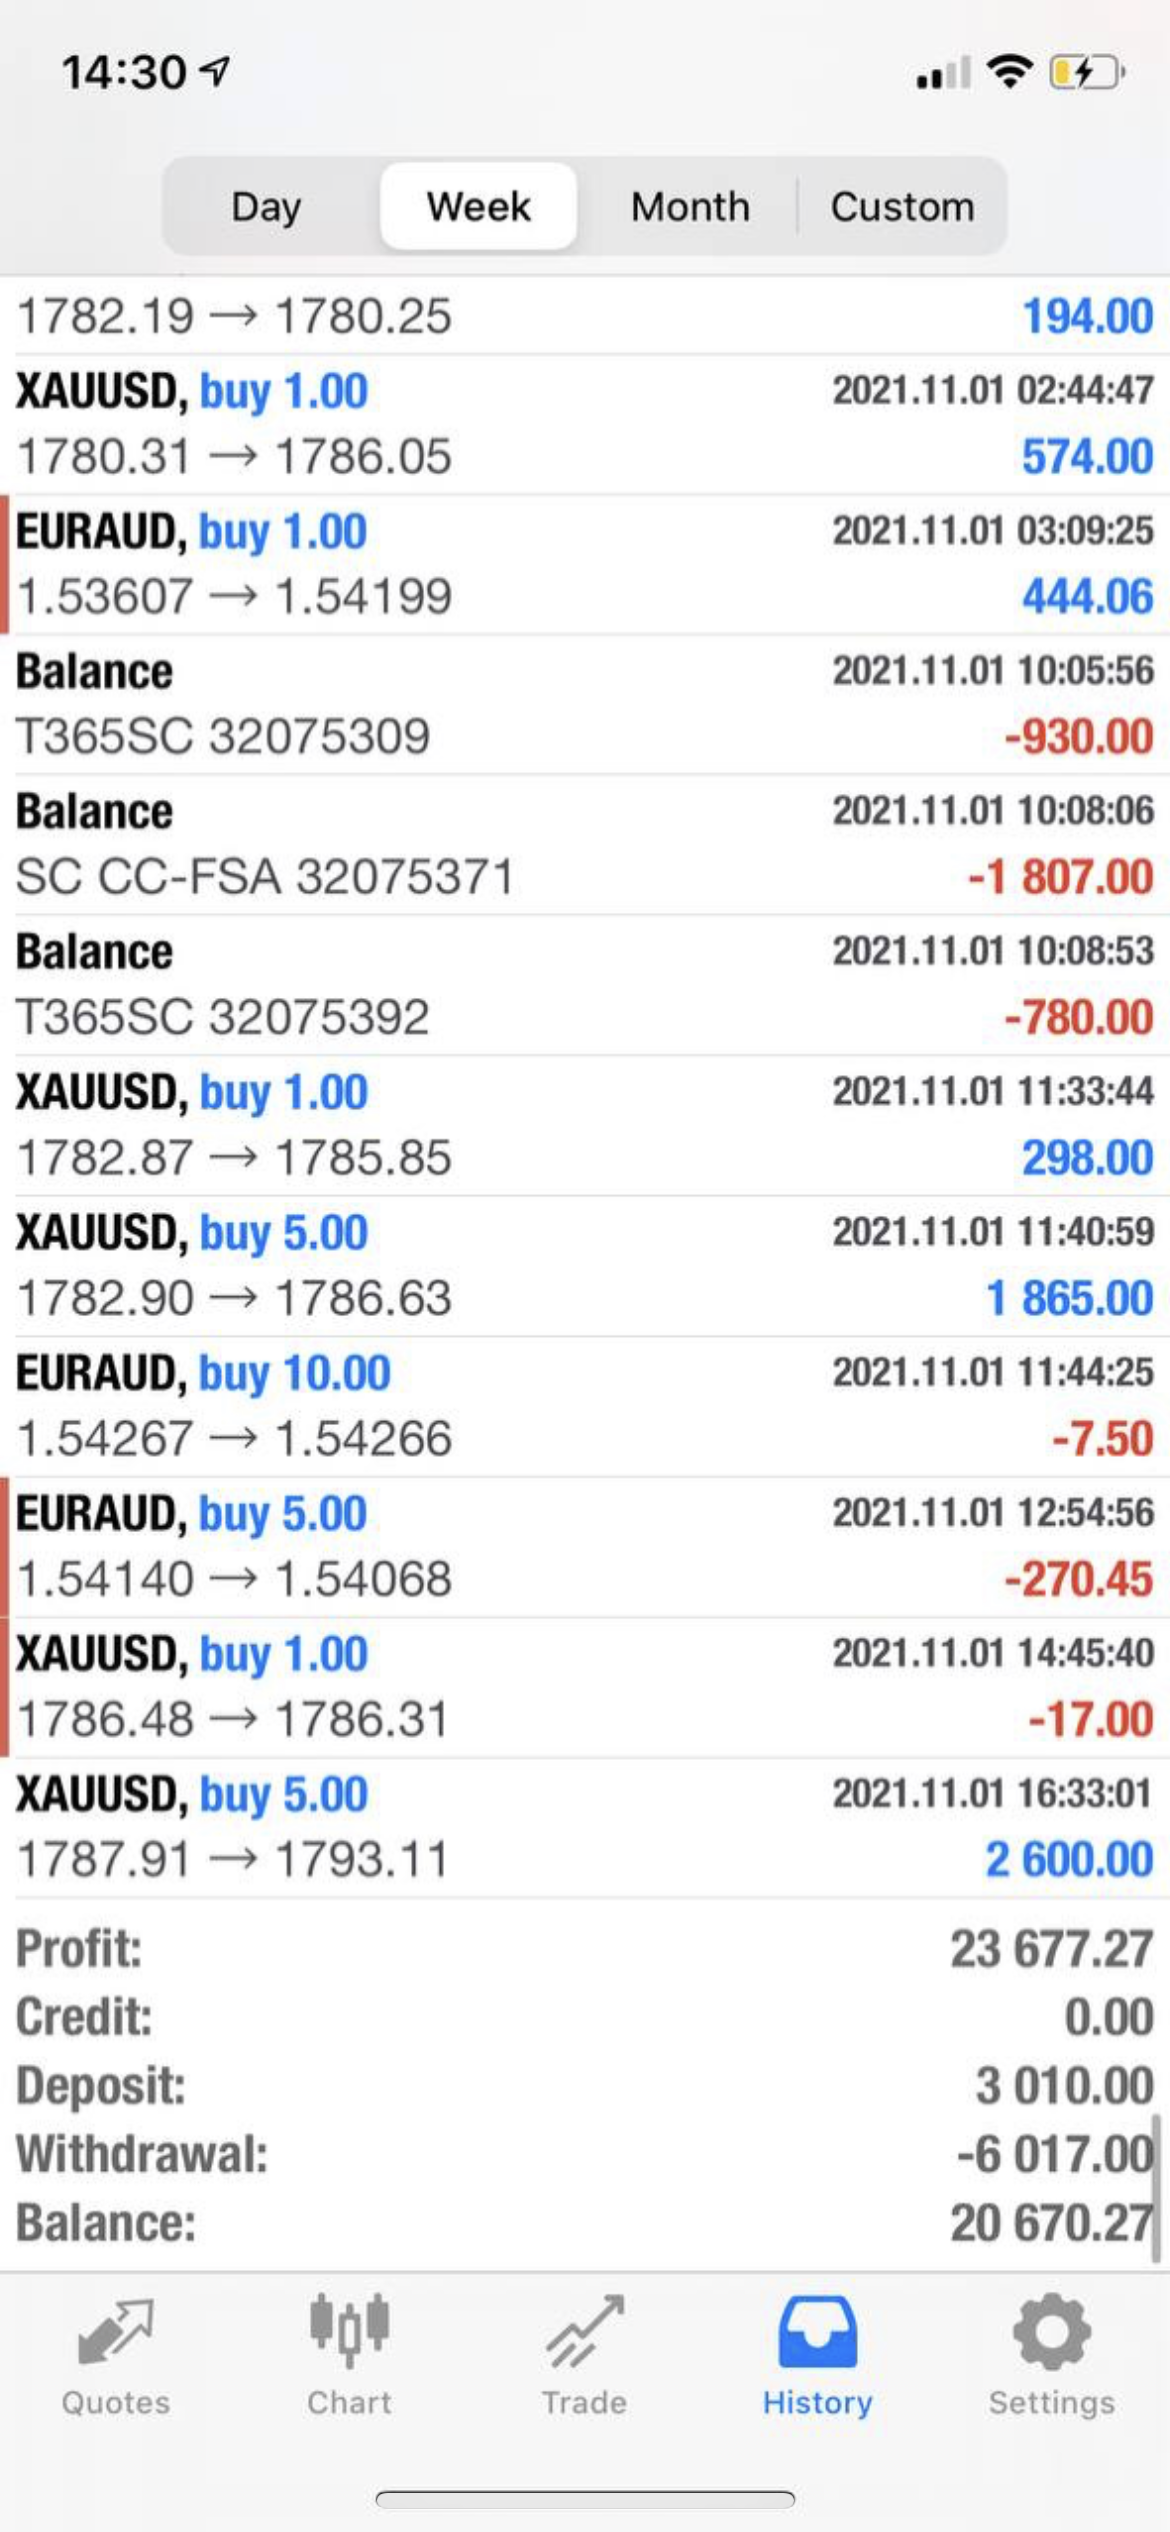
GBPUSD ShortCurrent battle of cautious, paused BoE vs. an aggressively easing Fed
The Fed has cut rates a total of four times (100bps) and has signaled a continued easing bias in response to sluggish growth. The Trump administration has also consistently used public rhetoric to advocate for a weaker dollar to boost US manufacturing.
The BoE cut once more in late 2024 but has since been on an extended pause. Stubbornly high UK services inflation, which has remained well above target, has prevented the MPC from easing further. This "hawkish pause" was unexpected by markets and has become a major source of Sterling strength.
The Starmer government successfully negotiated an expansion of the Windsor Framework, focusing on a new veterinary and agri-food agreement that has significantly reduced trade frictions with the EU. This has been viewed as a major long-term positive for the UK economy.
The Bank Rate stands at 4.75%. The market is now uncertain if the BoE will cut again at all in 2025
The Fed Funds Rate is now in a range of 4.25-4.50%. The FOMC is clearly in easing mode to support a soft economy
03/07/2025
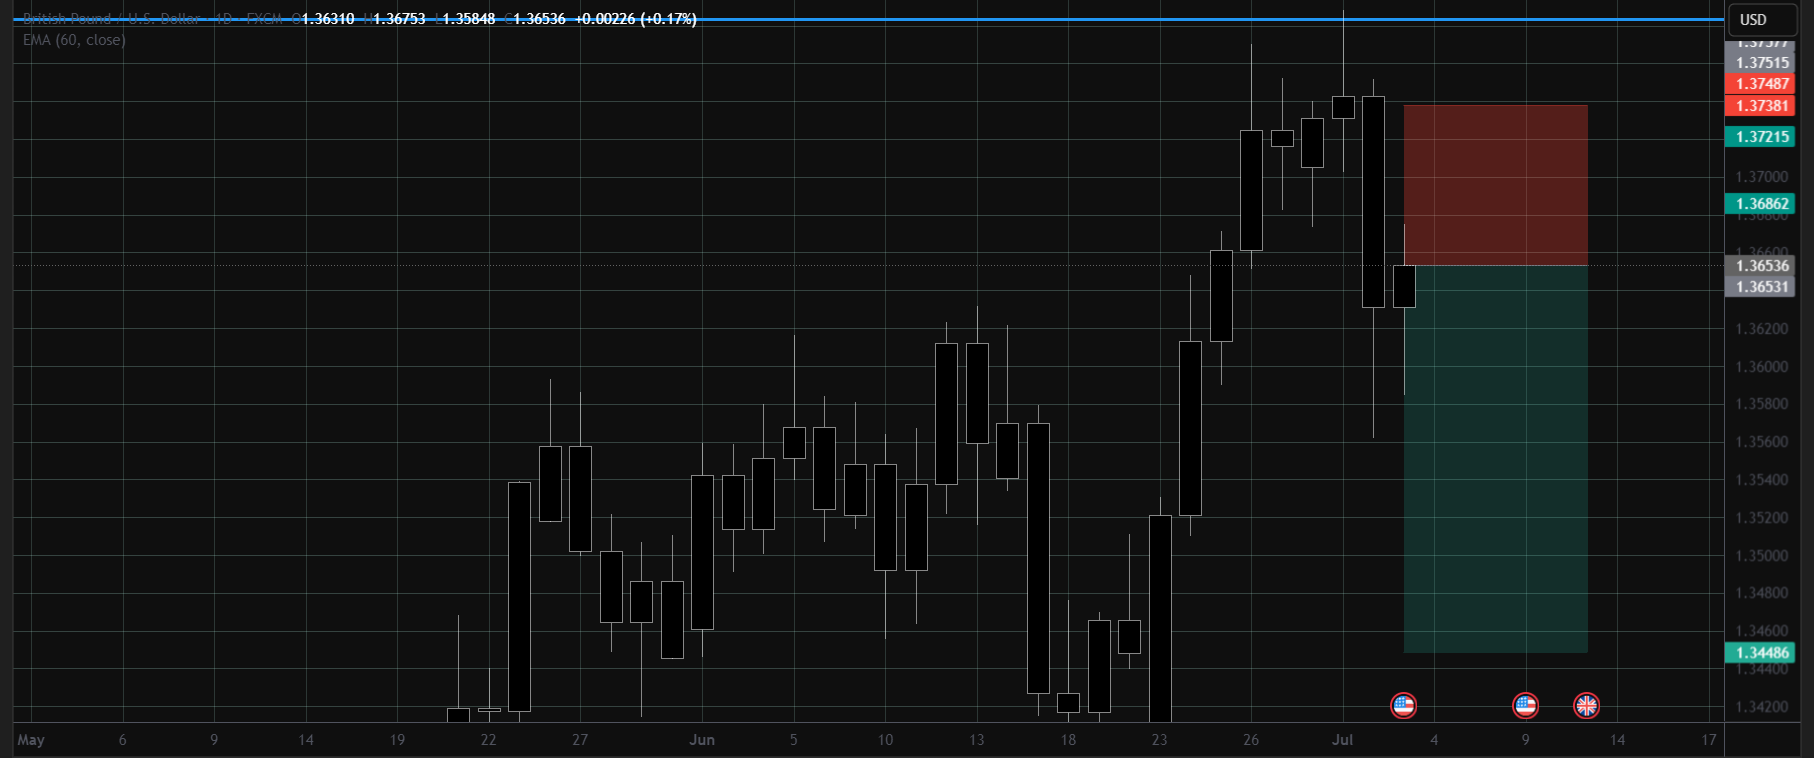
Trade Completed. 14/07/2025
Profit: 1.50%

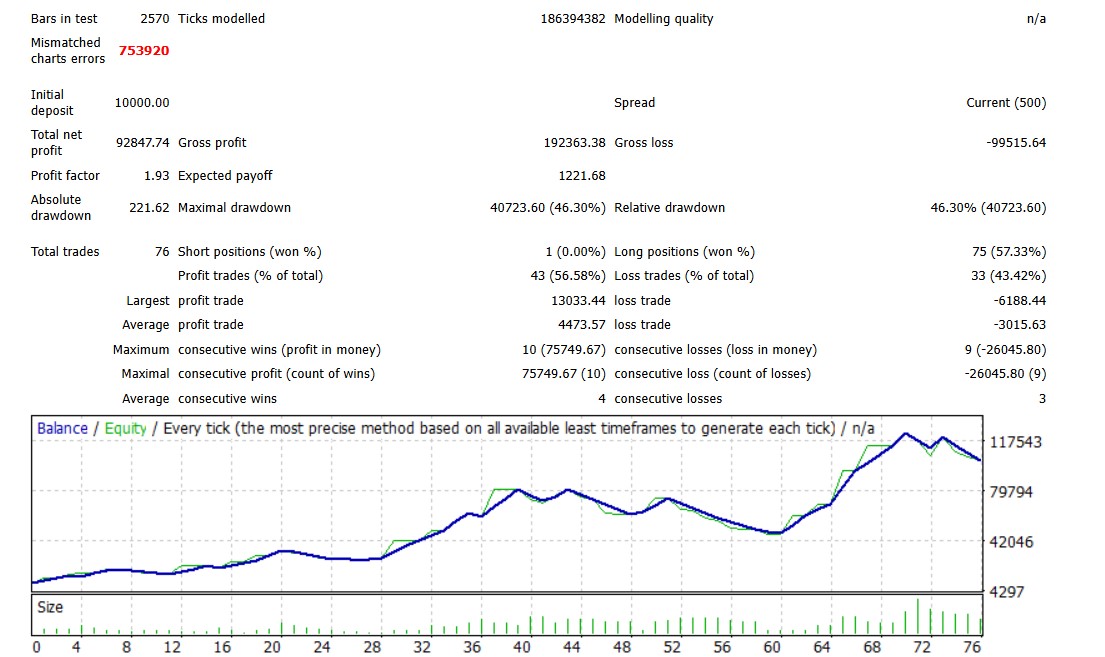
Foreign pairs are more volatile but due to the low risk, increase leverage as the risk is 0.62% so the return at 3% risk is 7.50%.
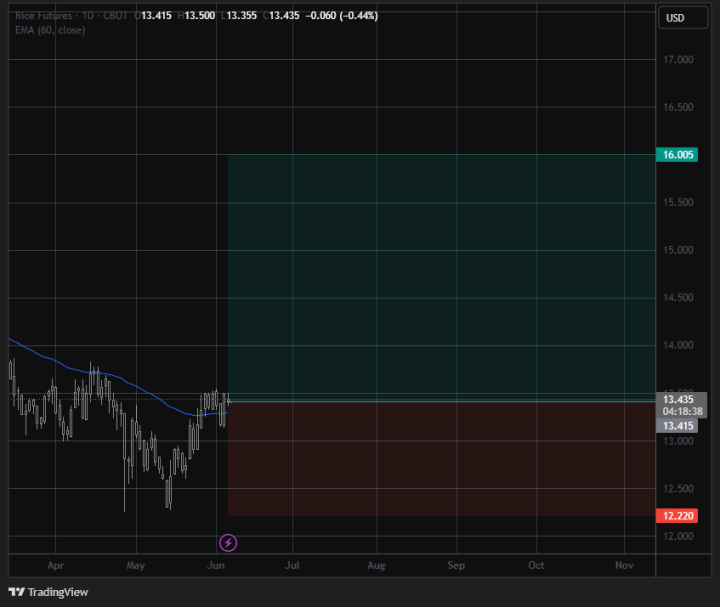
Rice Long
Global rice production for the 2024/25 season is forecast to reach a record 535.8 million metric tons (milled basis), nearly 3% higher than the previous year.
The FAO also projects a record global rice production of 538.9 million tonnes (milled basis) for the 2024/25 season
This increased demand is largely driven by population growth, urbanization, and dietary shifts towards rice as a staple food, particularly in Sub-Saharan African countries.
One market research report indicates the global rice market grew from USD 307.60 billion in 2024 to USD 315.63 billion in 2025 and is expected to continue growing at a CAGR of 2.58%, reaching USD 358.60 billion by 2030.
Global ending stocks in 2024/25 are forecast to increase to 183.2 million tons. For 2025/26, they are projected to be slightly higher at 185.1 million tons
We can see that from this demand is high with supply also matchcing. But this then also means if there is any weather effects price will drastically increase as the demand is only increasing.
05/06/2025
Trade Completed. 14/07/2025
Loss: 4.92%
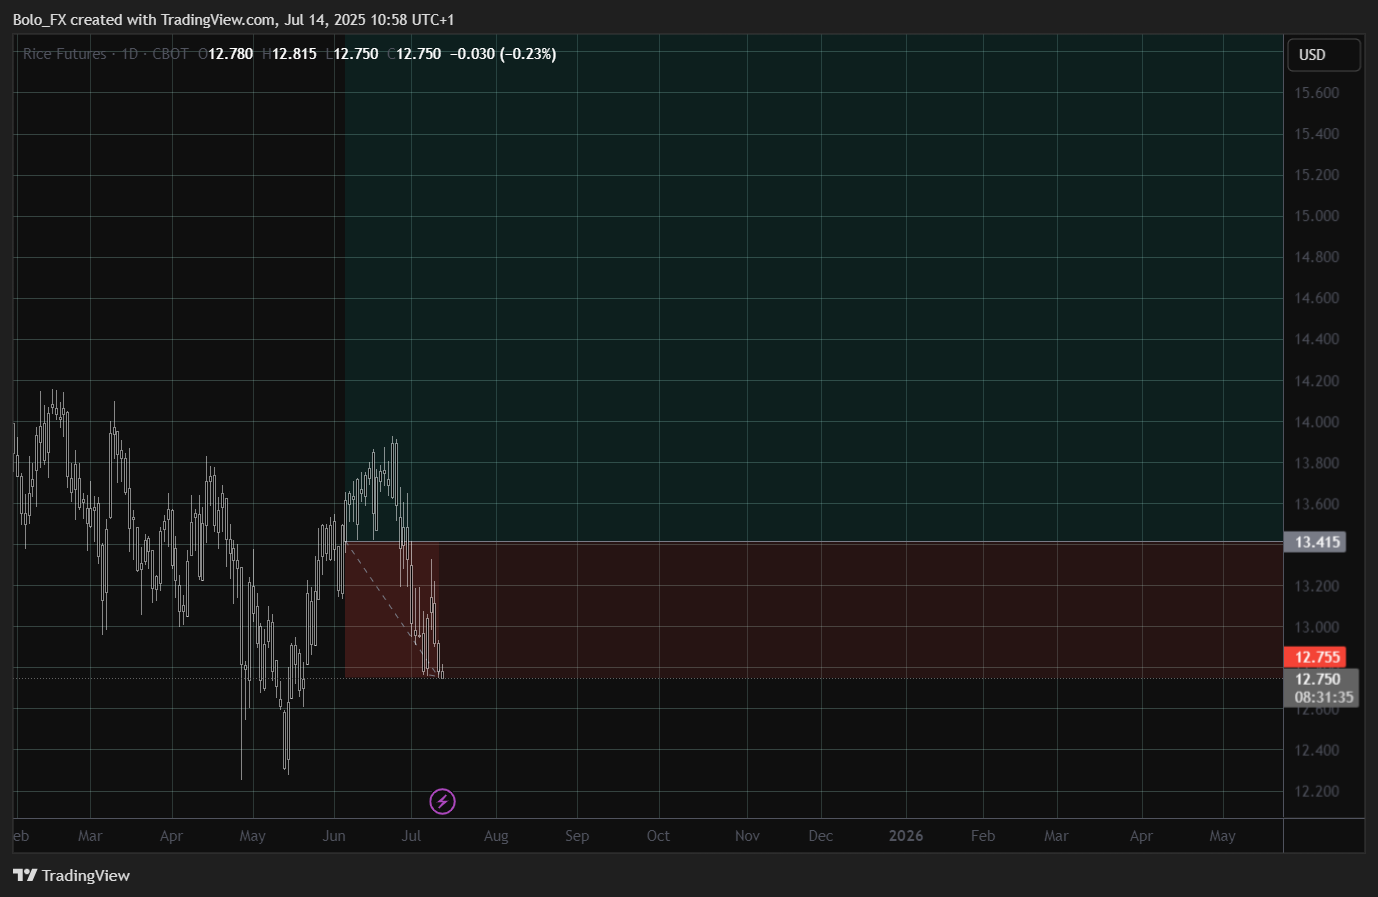
Took out the trade early due to very bearish sentiment. Strong bearish price action indicated price coming towards my stop loss area.
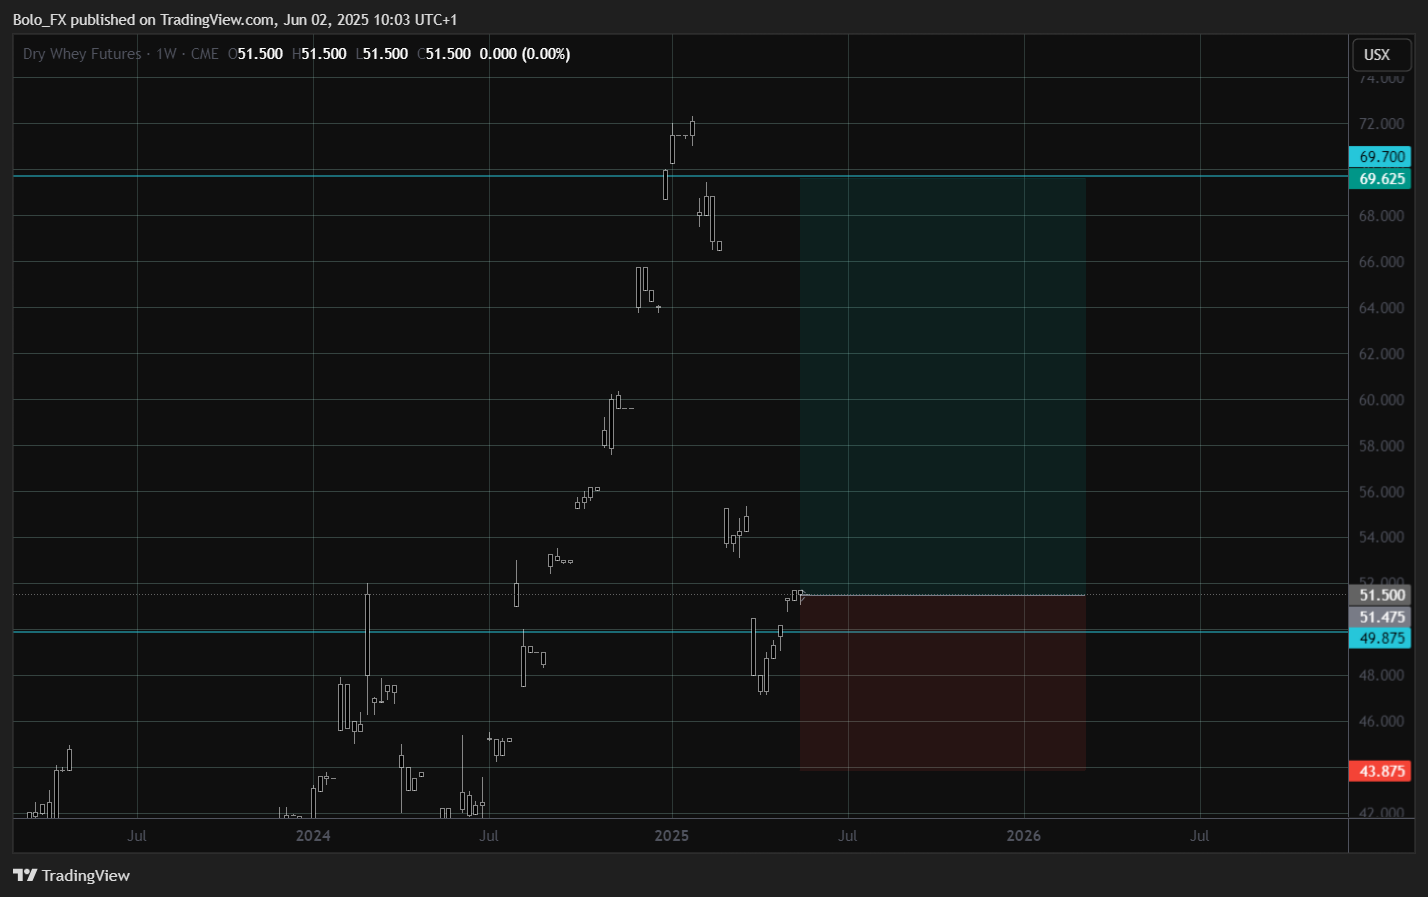
Dry whey longs. The May 2025 WASDE report projects an average dry whey price of $0.535 per pound for 2025. This was an upward revision from previous forecasts
A key theme is the divergence between sweet whey powder and whey protein concentrates.
This market is facing downward pressure, with reluctant buyers anticipating further price declines due to projected increases in milk volumes and adequate production capacity.
In March 2025, total dry whey production in the U.S. was 70.0 million pounds, down 12.4% from March 2024
But there is a Increasing health and fitness consciousness globally is a major driver for whey protein demand, particularly for WPC and WPI.
02/06/2025
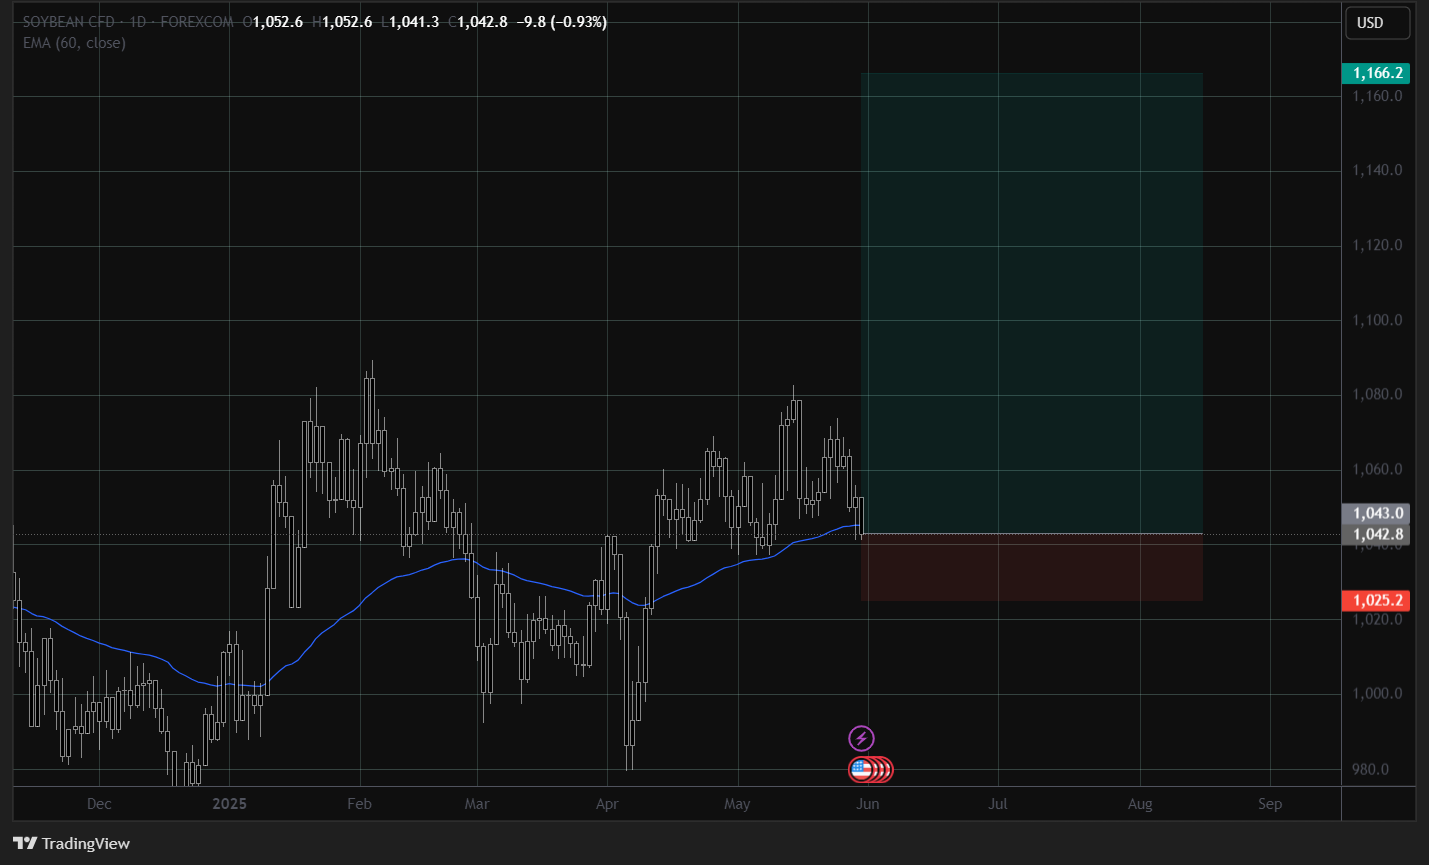
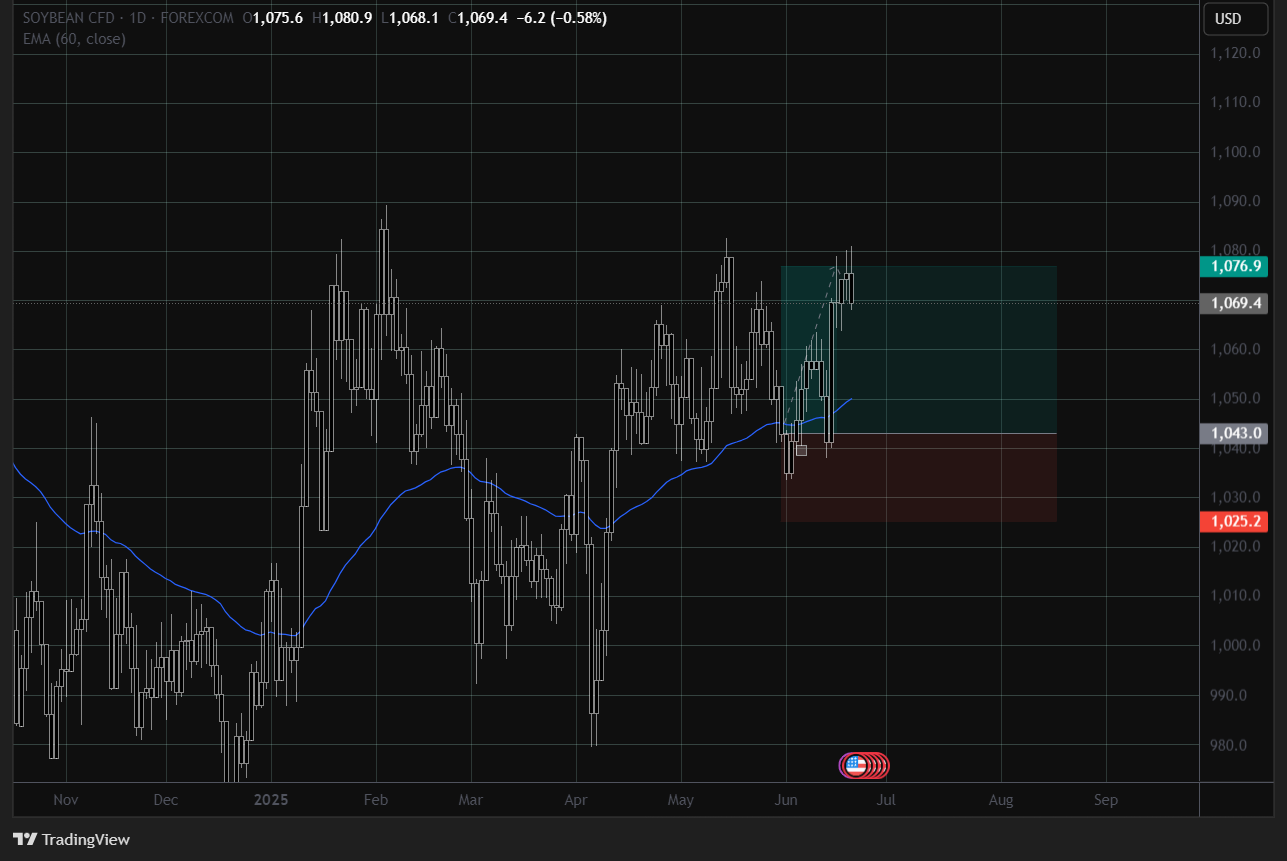
Soybean longs. This is due to seasonality reasons and also Severe Drought Impact: Official Zambian Gov. forecast (May 2024) projects 169,700 Metric Tons (a 78% reduction from the previous season). Some market analysts had estimated around 150,000 tons.
Even though WASDE reports have been bearish looking at the droughts and early harvests in Argentina, importers like China will be willing to pay more for the better quality harvests
With the curret soybean supply we are able to see that their is a forecast of a decline with the soybean prices.
When looking at soybean volume we can see huge volume on prices on the upsides, whilst on the downside the biggest liquidity pools are a further 200points.

This may mean without any fundamental reasoning or any governmental policies taking place short term money managers could push prices down 200 points for the short term but I believe this cannot be the case due to policies.
30/05/2025
Trade Completed. 19/06/2025
Profit: 3.25%
Due to the down side being extremely low at maximum 1.75% with a maximum drawdown of 0.85%, I increased my position significantly as 1.75% risk is very low in my strategy.
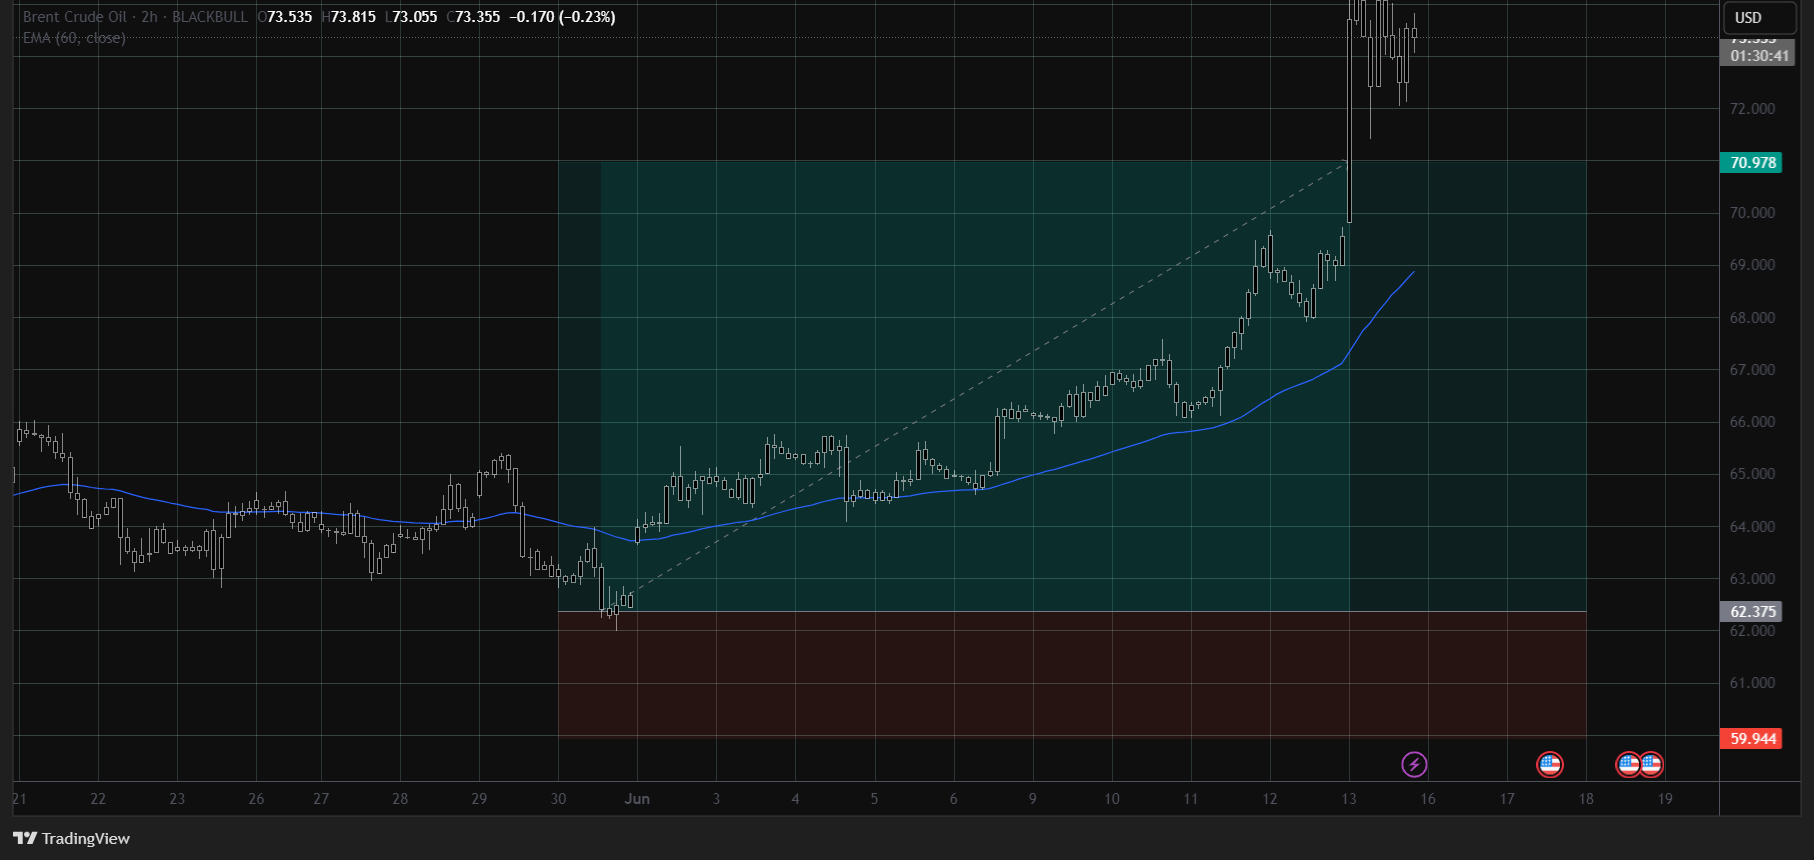
Brent oil Long. Looking towards brent oil we can see it is around a crucial price point. Furthermore looking at the managed money of brent oil we can see most money managers have now switched to a long position compared to a short position as seen for the last 5 months
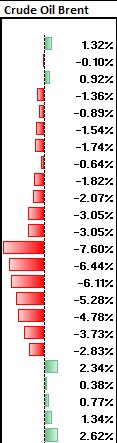
OPEC and its allies (OPEC+) have stated recently, they surprised the market by agreeing to a second consecutive monthly production increase of 411,000 barrels per day for June 2025
Increasing supply should reduce price but then managed money is long. This may be due to actual increase in supply being lower than the nominal figures due to some countries continuing to produce above targets, while others face capacity constraints or need to make compensatory cuts
Geopolitical risks, particularly in the Middle East, provide some underlying support and a risk premium
30/05/2025
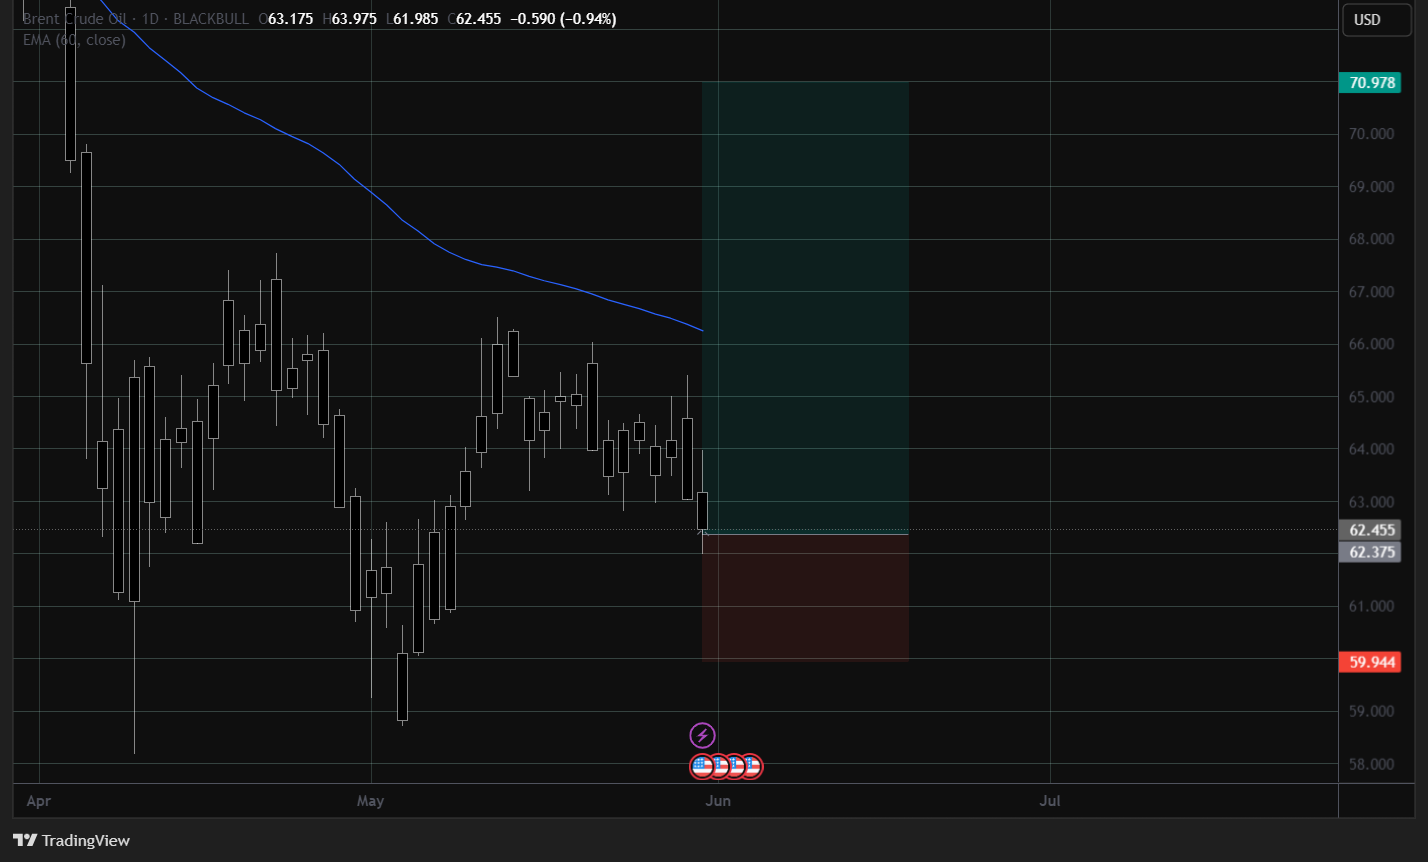
Trade Completed. 13/06/2025
Profit: 13.79%
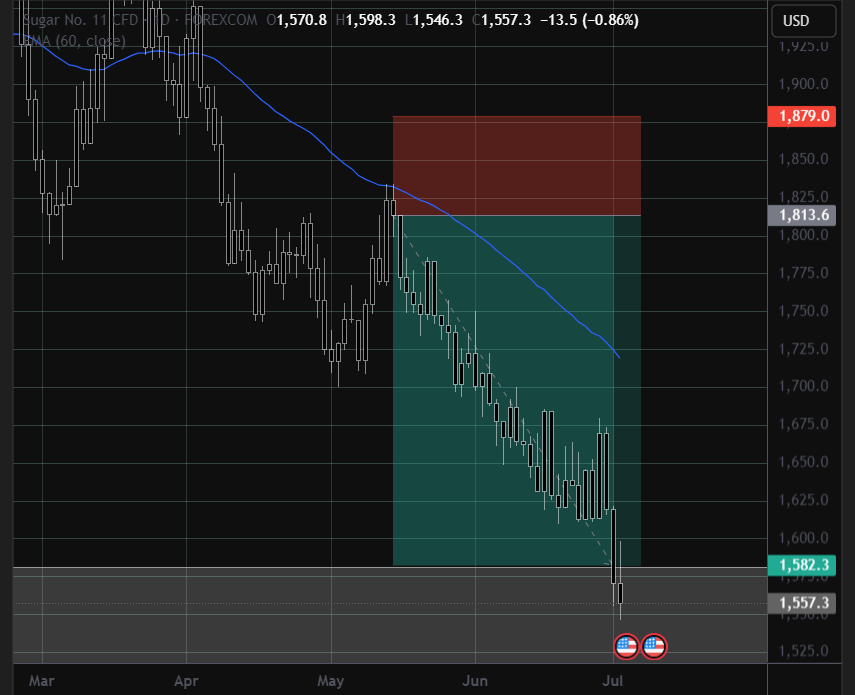
Sugar Short. For sugar we can see a trend of healthy diets emerging with companies also tackling the issue of sugar
This means that in the long run other artificial sweetners or replacements will replace sugar as seen in the substitution effect
But looking at data we are seeing these forecasts being projected of global sugar consumption which is projected to reach approximately 177.92 million metric tons in the 2025/26 season, an increase from the estimated 175.44 million tons in 2024/25. This represents a growth of about 1.4%
But global sugar production is forecast to increase to 189.3 million metric tons in 2025/26. This increase is largely driven by expected bumper crops in Brazil and India.
This can indicate over supply of this crop so the following idea is a short term idea
14/05/2025
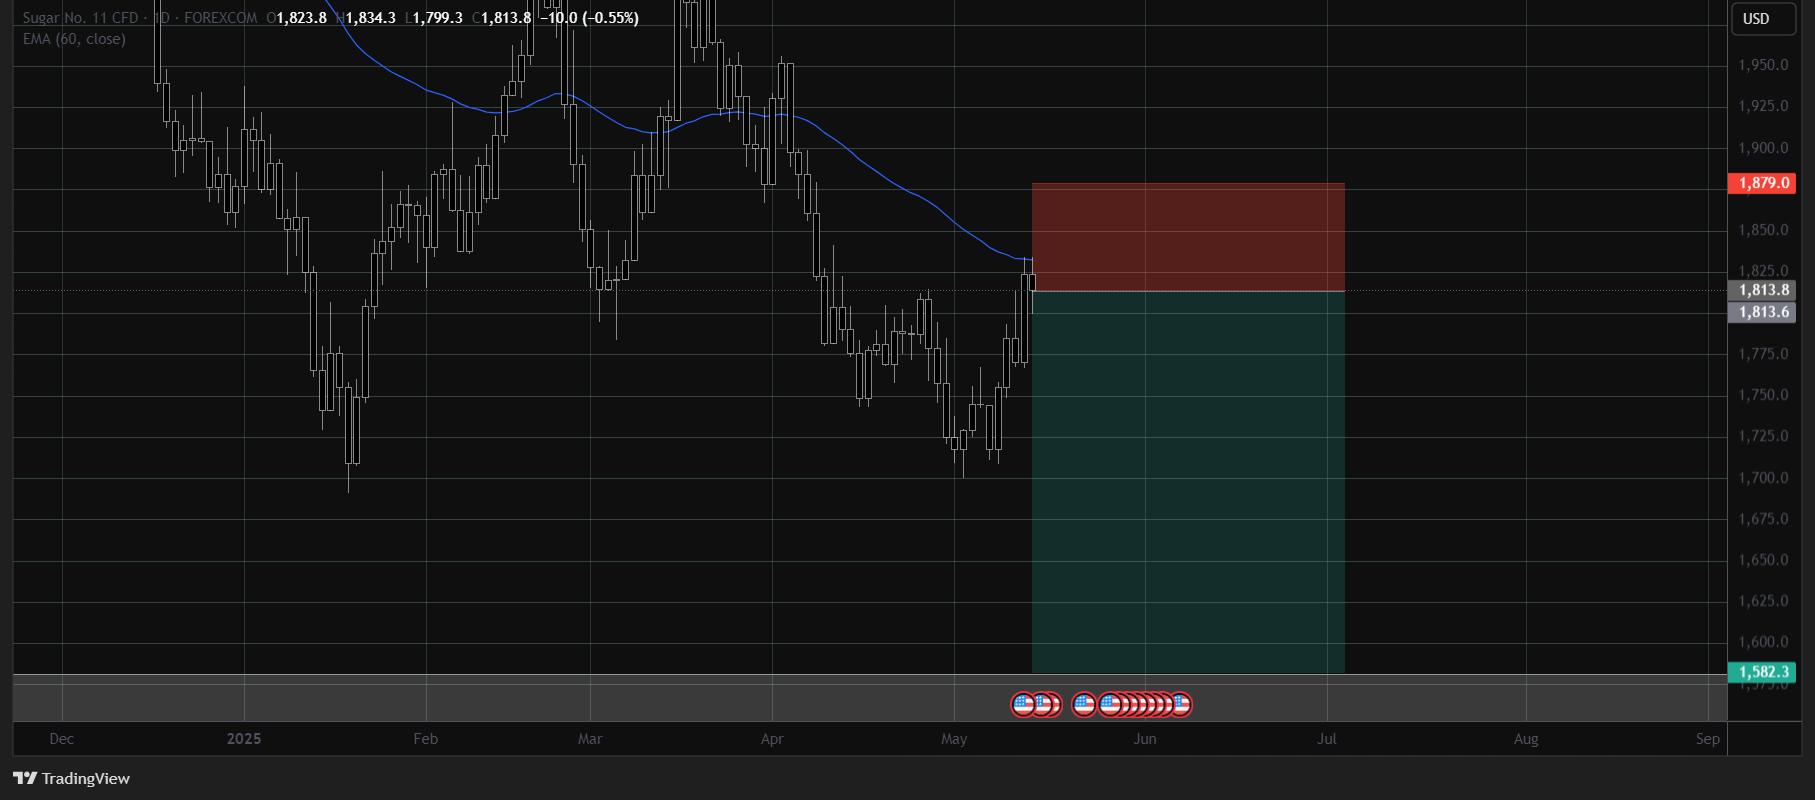
Trade Completed. 01/07/2025
Profit: 12.75%
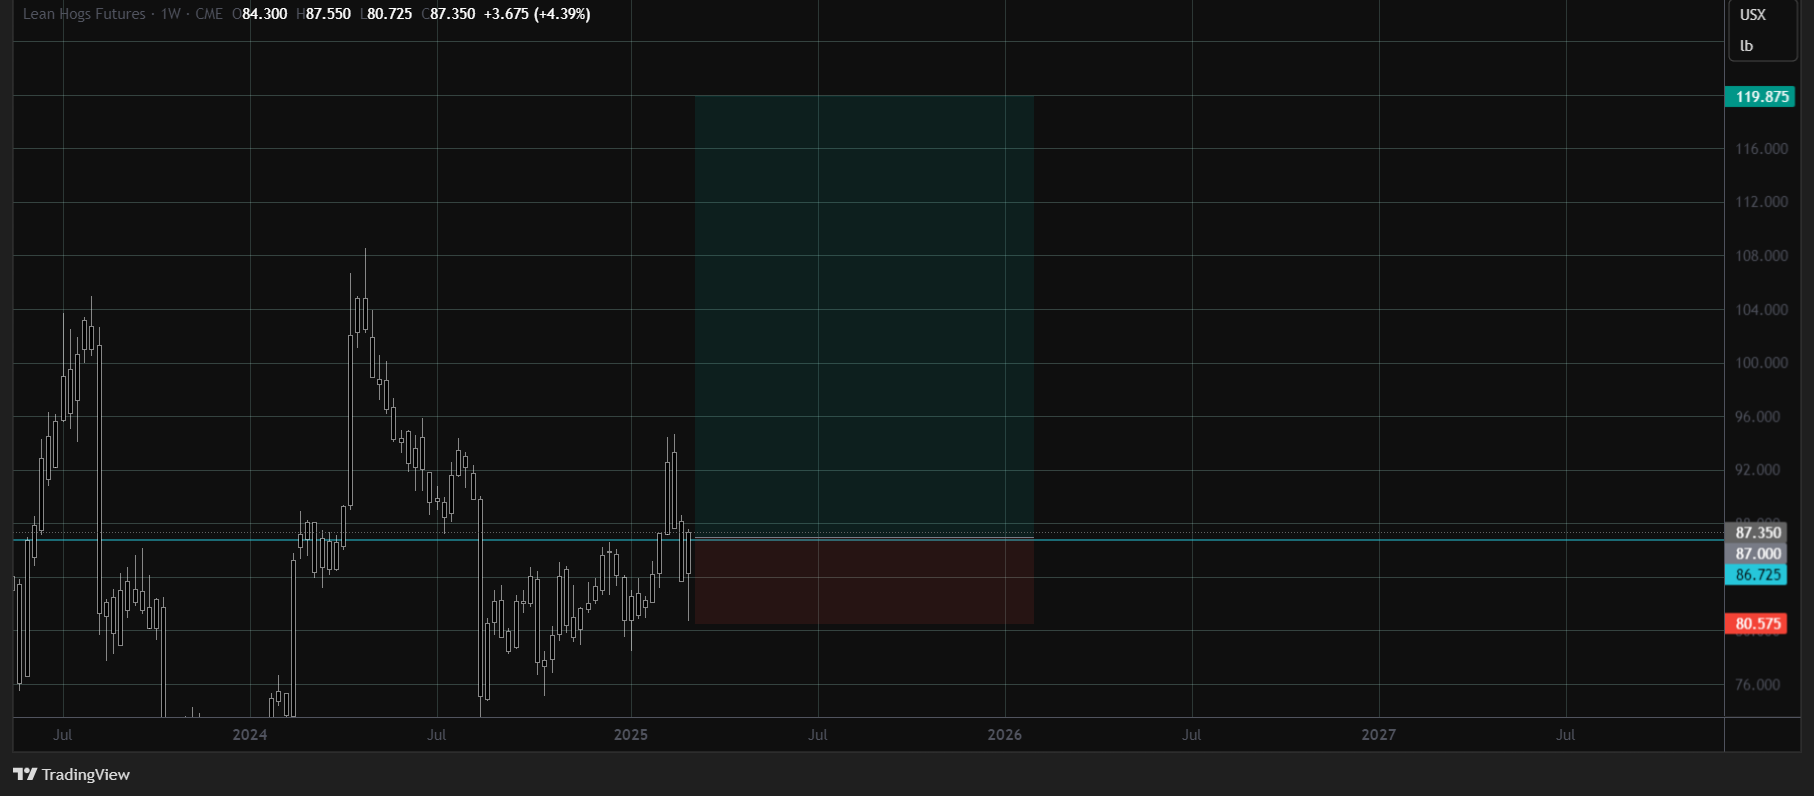
Lean Hog Long. Looking at lean hog futures we can see strong bullish sentiment. Forecasts suggest a 2.7% increase in pork production compared to 2024
In China, lower pig slaughter is anticipated due to reduced sow numbers and improved pig performance which will decrease supply increase demand
Volatile feed costs, though generally lower in North America and Europe, remain a significant factor.
03/03/2025